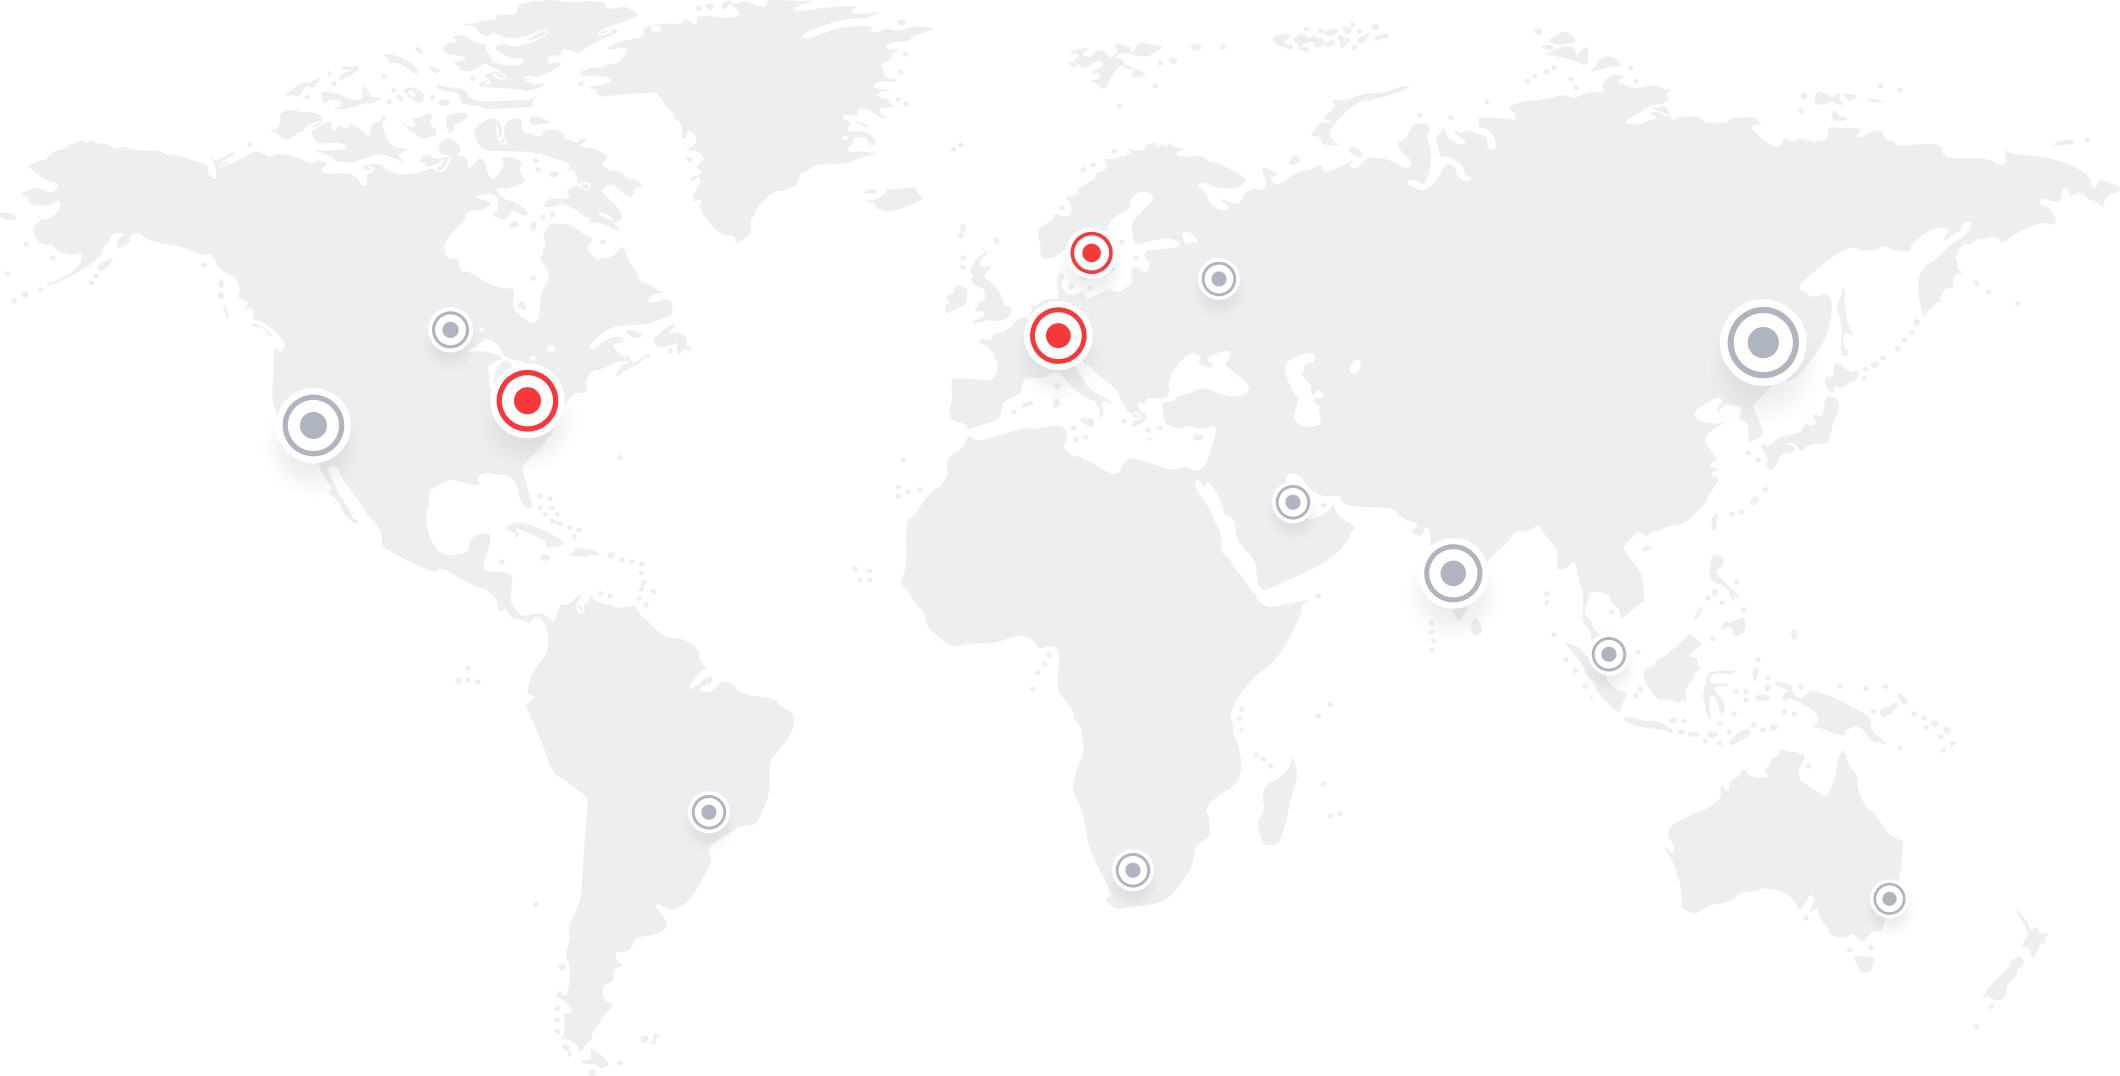
Worldwide uptime monitoring within 15 minutes
- Ensure smooth global operations
- Start with our Grafana uptime dashboard
- All metrics aggregated in your own Prometheus
10+
Locations
40+
Instances
4
Continents

Managed Prometheus Exporters
Check your infrastructure from multiple locations managed by us.
Blackbox Exporter – HTTP, DNS, TCP and ICMP checks
SSL Exporter – TLS certificate checks
TLS Grade Exporter – TLS setup rating
Google Lighthouse Exporter – Website performance rating soon
Your metrics, your data
Request website availability and performance metrics from our managed Prometheus Exporters. Store and analyze the metrics in your Prometheus data store.

All features are free during pre release phase
Free Plan
- 200 Probes every 60s (or e.g. 100 Probes every 30s)
- 3 Test locations
- Blackbox-Exporter
- SSL-Exporter
- TLS Grade Exporter
Free
Sign UpEnterprise Plan
- Unlimited probes Need special setup?
- 4 Test locations need more?
- Blackbox-Exporter
- SSL-Exporter
- TLS Grade Exporter
- Email Support
€39/month
Worldwide Check Locations
Use our test locations around the globe to test your infrastructure. Verify website accessibility from different regions and use multiple locations to form a quorum for alerting decisions.

 Prometheus Monitoring
Prometheus is a free and open source software application used for event monitoring and alerting. It records real-time metrics in a time series database (allowing for high dimensionality) built using a simple HTTP pull model. It provides flexible queries and real-time alerting. Since 2018 Prometheus is a graduated project of the Cloud Native Computing Foundation along with Kubernetes.
Managed Prometheus Exporters
Prometheus utilises Exporters as its primary metric data sources. Exporters are available for most infrastructure components such as load balancers and databases. Prometheus pulls available metrics from the configured Exporters into its time series database.
The Blackbox Exporter checks websites or certain URLs for configured HTTP response codes. It furthermore can connect to hosts via configurable TCP protocols, test DNS servers for entries or simply ping endpoints via ICMP. Besides metrics of a configured target being available, it returns metrics about probe latency, DNS lookup and TLS handshake duration.
The SSL Exporter checks the SSL/TLS handshake with an endpoint and provides valuable information about the used certificate and encryption ciphers. For secure websites, metrics about OCSP stapling are also provided.
ping7.io open source observability
ping7.io configures and runs proven open source observability components like the Blackbox Exporter and the SSL Exporter. Soon we'll also make the Qualsys TLS Exporter for website TLS setup metrics and the Google Lighthouse Exporter for website performance metrics available.
We run those Exporters for you so you do not have to care about running, configuring or updating them. All you have to do is configure our exporters as targets in your Prometheus installation.
When running the Exporters yourself, you'd typically set a single Exporter instance. If that instance fails or is under maintenance, you might have false alarms. Furthermore metrics are limited to the data center running your Exporters. What if results look dramatically different from another data center? With us you gain metrics from different locations scattered around the globe. Use metrics from multiple locations to form a quorum on alerts. Don't rely on metrics by a single exporter, always rely on metrics from an uneven Exporter count.
Ping7.io is made by observability professionals for observability professionals.
Sign up now and start gathering metrics!
Use our managed Prometheus Exporters and achieve deeper insights to your website availability.